Dashboard
Balances, launch outcomes, portfolio performance and the live Mooners feed.
The Dashboard puts account totals above a performance chart and the live Mooners feed. Choose a chain or the combined view to set their scope.
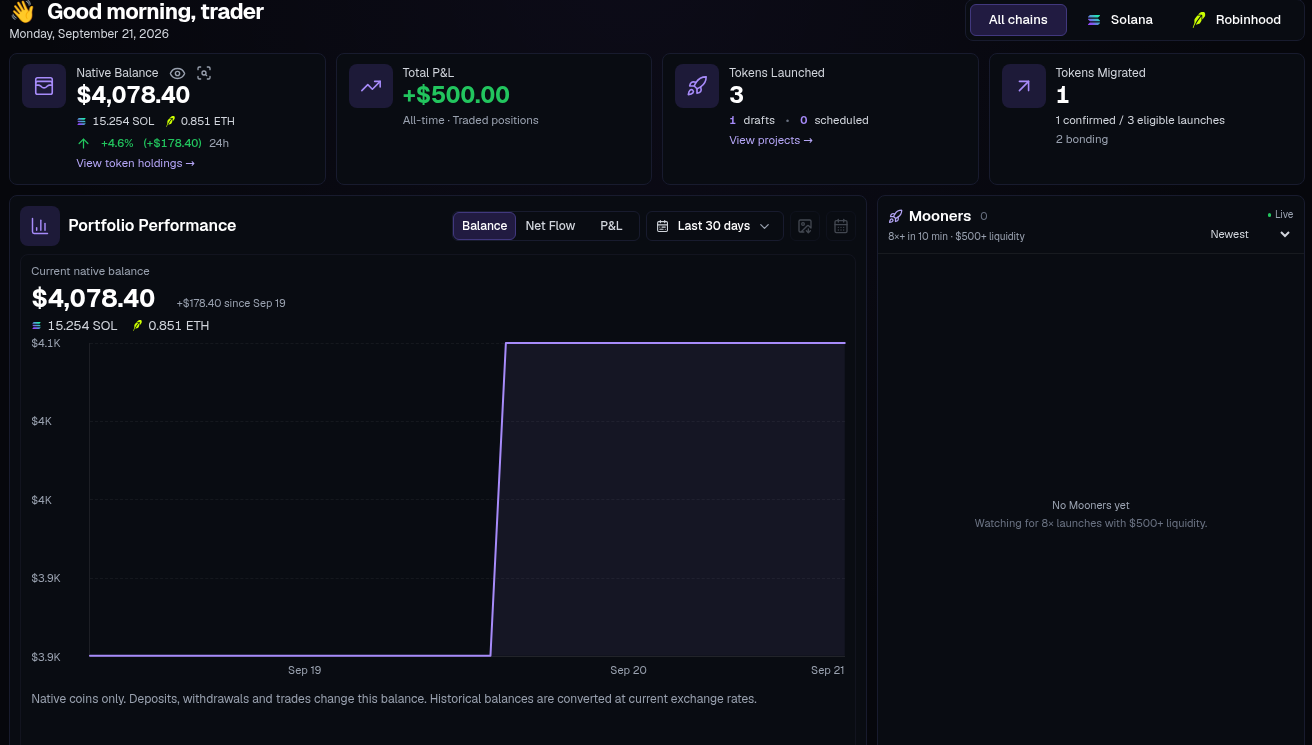
Cards#
- Native Balance — SOL/ETH held in your wallets. Token holdings are separate; use View token holdings to open your portfolio. The eye button hides the balance and performance amounts.
- Total P&L — current all-time result across recorded traded positions: trade cash received minus spent, plus estimated proceeds from selling remaining tokens. If some held tokens cannot be priced, the card becomes Estimated P&L: all trade costs and proceeds remain included, but unpriced holdings add no value. Missing trade records or an unavailable holdings inventory still show —.
- Tokens Launched — distinct real launches in your projects, excluding drafts, simulations and imported/CTO projects. Drafts and scheduled launches appear underneath.
- Tokens Migrated — confirmed migrations among your eligible curve launches. A confirmed migration stays counted after liquidity is removed. Older migrations without recorded confirmation are shown as unverified, rather than assumed successful from an AMM pool alone.
Performance#
The selected view changes the headline number and its scope:
- Balance shows your current native balance, sampled history and change since the first sample in the selected window. Deposits, withdrawals and trades all change this balance.
- Net Flow shows trade cash received minus spent over the selected 7, 30 or 90 UTC days. It is not profit. The calendar and share buttons belong to this view.
- P&L keeps the original dated line with 7/30/90-day controls. The line shows cumulative trade cash over the selected period; the headline separately shows current all-time position P&L, including priced holdings.
All-chains figures convert each chain using its current exchange rate. They are not historical USD valuations. Missing prices or incomplete accounting leave combined totals unavailable.
Mooners#
The feed shows observed launches from the last 24 hours that reached 8× or more within their first 10 minutes, with at least $500 in verified real quote-side liquidity. A peak multiple is a past spot-price move in the launch quote, not a current return or sell quote.
Choose Newest or Highest peak. Click a token to trade it, copy its address, or expand its details for description, creator and launch links. Social and explorer links appear where available. Live, Connecting or Unavailable shows the feed's connection state.
Continue from the Dashboard#
Use Projects to compare and open your launches, Tasks for automation, and Operations for saved conversions and closeouts. New accounts also see guided starting steps for launching, trading or managing wallets.